
Home » Posts tagged 'R'
Tag Archives: R
GGPLOT Graphics for NFL Stats
GGPLOT2 is a package developed for producing graphics within the R statistical tool. It utilizes a layering metaphor for gradually adding visual details to the desired output. R can support datasets with millions of rows for various aggregation and analysis operations, but it can be slow, unwieldy to code in, and has memory limitations. Continue…
Layering in R for Oracle Data

NZ kiwi #1
Visualizing Oracle data: Tree Maps
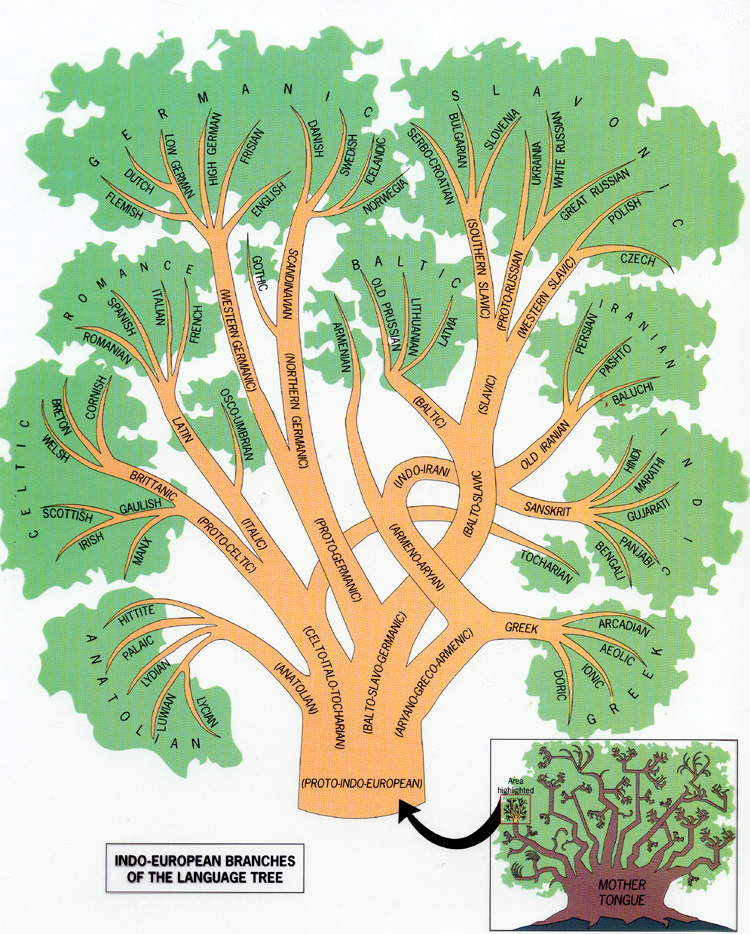
tree of languages, indo-european
I recently wrote about the R statistics and graphics platform, and introduced it as a way to do further analytics or visualizations for data from Oracle databases. This article will take a look at a graphical idea called tree maps. They are an extension of the more basic visualization technique: heat maps. Continue…
R with Oracle
 The data presentation graphic at right, and many of those sprinkled throughout this article (click them for better resolutions), are highlights from an enthusiast’s gallery which have been produced by the R statistical software package. R is an open-source programming language and environment which has gained much popularity among academics who want to apply statistical methods Continue…
