

inverted td catch! check out the right hand of #15. credit: anthony souffle / chicago tribune
Week 2
Joys of early season outliers: Exciting weekend for those who favor close games and nail-biters! Consider this: 3 games were decided by the smallest possible margin — 1 point. We had KC over DAL, 17-16; BUF over CAR, 24-23; and CHI over MIN, 31-30. The latter two of these were decided in the final seconds. Another game was tied after regulation, HOU defeating TEN in overtime 30-24. Most of the weekend’s games were close; in fact only five were decided by a margin of more than 8 points (or one score). In what follows, CLOSE games are defined as being decided by margins of 8 or fewer points, or one score, and BLOWOUTS are defined as games decided by margins of 20 or more points (at least 3 scores). Also depicted are the average point margins. Although it’s early in the new season, you can see that games are about 5 points closer (more exciting?) in general for 2013 than 2012 thus far. The yearly pace for total close games is also ahead of last year significantly, while the pace for blowouts trends less.
 The NFC East went 0-4, and three of these defeats came at the hands of the AFC West, which went 4-0 during Week 2. That represents a distinct reversal of possible fortunes compared to the past half dozen years or so, in which the NFC East enjoyed the strong division reputation as opposed to the AFC West’s role as perennial weakling.
2-pt Safety Tracker: The Seahawks took a 2-0 lead over the 49ers midway through the 2nd quarter, caused by a holding penalty in the endzone. The Texans also scored a safety against the Titans. That makes the running total 6 on the season so far.
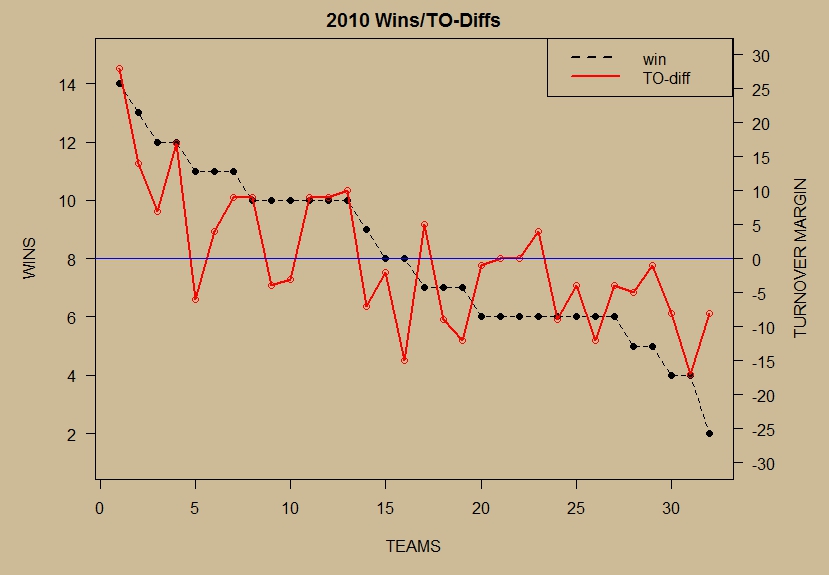
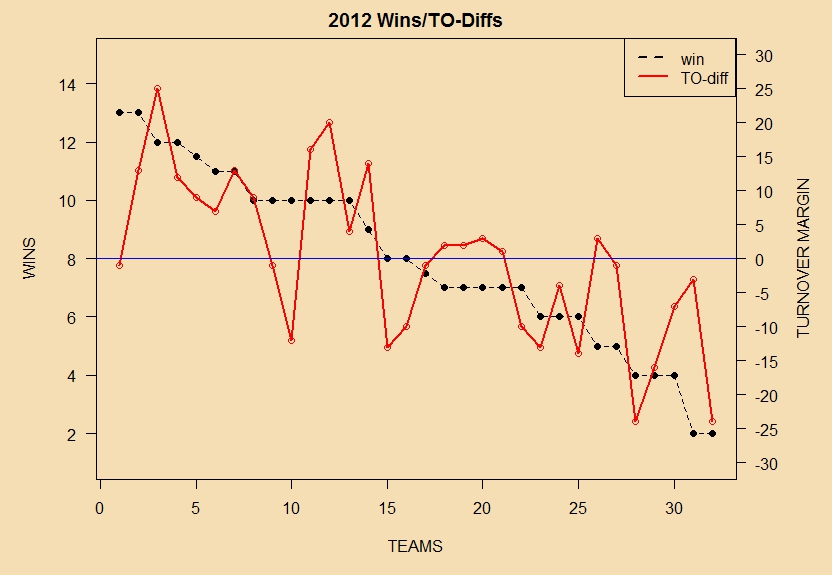
Correlation Skeptic: I decided to revisit last week’s turnover impact analysis, and extend it backwards in time a few football seasons. I showed that the correlation score between winning games and having positive turnover differentials (i.e. takeaways minus giveaways) was .686 for the NFL 2012 season. This is an okay correlation score, but a bit of a step down from the common perception which is closer to a slam-dunk relationship. So, is 2012 typical? I fetched the data for 2009, 2010 and 2011 and computed the same correlations (below):
 The correlation was even even slighter for the 2011 season, but the mean correlation over the four years evened out at .660. Mind you, these are correlations for differentials — the degree of correlation for pure takeaway counts would be even less apparent. There are just too many other mitigating factors within NFL games to permit this statistic to be a reliable predictor for winning, even over the course of seasons or years. Few teams per season even average better than ±1 per game in their turnover differentials.
view R code
w h i t e s p a c e

w h i t e s p a c e

w h i t e s p a c e
Stats Viz 2013
Team seasonal results are visually uninteresting with low datapoint counts early in the NFL season. So, be patient. They will appear regularly around week 3 or 4.
Notes
1) I use 2.37 as the exponent for computing Pythagorean Wins instead of the vanilla 2.00. The reason has to do with the fact that the usual exponent was originally developed, by Bill James, for major league baseball which has a sample size of 162 regular season games. In the NFL, there are only 16, so the hand of chance plays a more visible role and must be compensated for. This link will justify the math if you’re interested.
2) I count ties as half-wins (and also half-losses). The statistical reason is obvious. A 7-8-1 team, such as last year’s St. Louis Rams, has to be distinguishable from both an 8-8 team and a 7-9 team (for example, last year’s Dallas Cowboys and Carolina Panthers, respectively). Note that the average number of ties during an NFL season, league-wide, is in recent decades less than 1.
3) Pythagorean Wins, for those unfamiliar, is a measure of expected wins based upon comparing a team’s points scored (Offense) and points against (Defense) over the course of a season. Read more about it here.
4) The basic philosophy I am following is that professional football is a team sport, and therein all the drama lies; so for the present at least, I am eschewing individual player stats. Also, there is an effort to see how much can be revealed, in terms of data visualization, with the least raw data. More with less. The three main graphics, comparing team offense and team defense, actual wins and Pythagorean wins, and blowouts versus close game results — all can be driven off a very simple table of weekly results during the season. Perhaps other visualization ideas, employing other datasets, will occur to me later on as time permits, or I can consider requests.
5) Most of this stuff, minus the animated GIFs, has been pioneered in non-football posts at Hearing the Oracle. For example, the end of season NFL 2012 graphics for offense vs. defense and actual vs. Pythagorean look like this:

NFL 2012 team offense vs. team defense

NFL 2012 Actual vs. Pythagorean wins
To further orient yourself, you can look at relevant posts about Oracle SQL, R, and the NFL 2012 season below:
• GGPLOT graphics for the NFL 2012 Season
• Introduction to using R with Oracle databases
• Accessing the Original 2012 Spreadsheet
• SQL queries and results for NFL 2012
w h i t e s p a c e
6) This Week’s Credits: NFL Nerds Foto of the Week is by Anthony Souffle for The Chicago Tribune, capturing Chicago’s Brandon Marshall as he preserves his TD catch while tumbling upside down. I like the scope, variety and point of view in Anthony’s work — you can learn more at his website.
~RS

Hello nice bblog
thanks! It has been awhile since my Oracle days. Funy thing: one year after I made up this sort of visual graph showing NFL team strengths, I began seeing the exact same idea at SI websites devoted to analytics. 🙂 Coincidence? Maybe.
hello nice kkkomment!